RICS Construction Productivity Report 2026
-
 Email
Email
-
 Facebook
-
 Linkedin
-
 Twitter
-
 Whatsapp
09 March 2026
Productivity in Construction
Productivity sits at the heart of construction sector performance, shaping project timelines, profitability, and the industry’s capacity to meet crucial infrastructure and housing demand. Yet McKinsey’s 2024 research finds global construction productivity grew by just 0.4% annually between 2000 and 2022, compared with around 2% for the total economy (a total improvement of only 10% over more than two decades). With global construction spending projected to rise from $13 trillion in 2023 to $22 trillion by 2040, closing this productivity gap is becoming increasingly urgent.
This article presents findings from the RICS Global Construction Monitor, drawing on responses from nearly 3,000 construction professionals across five regions: UK, Europe, Americas, Asia-Pacific (APAC), and Middle East & Africa (MEA).
Key findings
The data reveals an industry facing measurement fragmentation, significant regional variation, a persistent optimism bias, and a clear consensus that workforce skills (not technology) remain the primary driver of productivity improvement. No single definition of productivity commands even 30% adoption in any region. Benchmark usage is low (5–16%). One in five UK firms never measures productivity at all. And across every region, expectations for the year ahead significantly outstrip recent experience, and it is not yet clear whether the industry’s optimism is matched by concrete plans for delivery.
How the industry defines productivity
The industry uses a wide variety of approaches to define productivity. Earned Value over Actual Cost holds a slight lead in most markets (24–29%), but the Americas diverges, favouring Output per Worker Hour. This was also visible in the 2023 survey, suggesting a structural difference in how the region conceptualises productivity rather than a one-off result. In every region, between 33% and 42% of firms use methods outside the top three, with APAC the most fragmented at 42% and Europe the least at 33%. This lack of a common framework undermines benchmarking, limits the ability to aggregate research findings, and makes it difficult to compare performance or transfer best practice across firms and regions, likely contributing to the low benchmark adoption rates that follow. Greater convergence on definitions would not only improve benchmarking but could also help policymakers and industry bodies design more targeted productivity interventions.
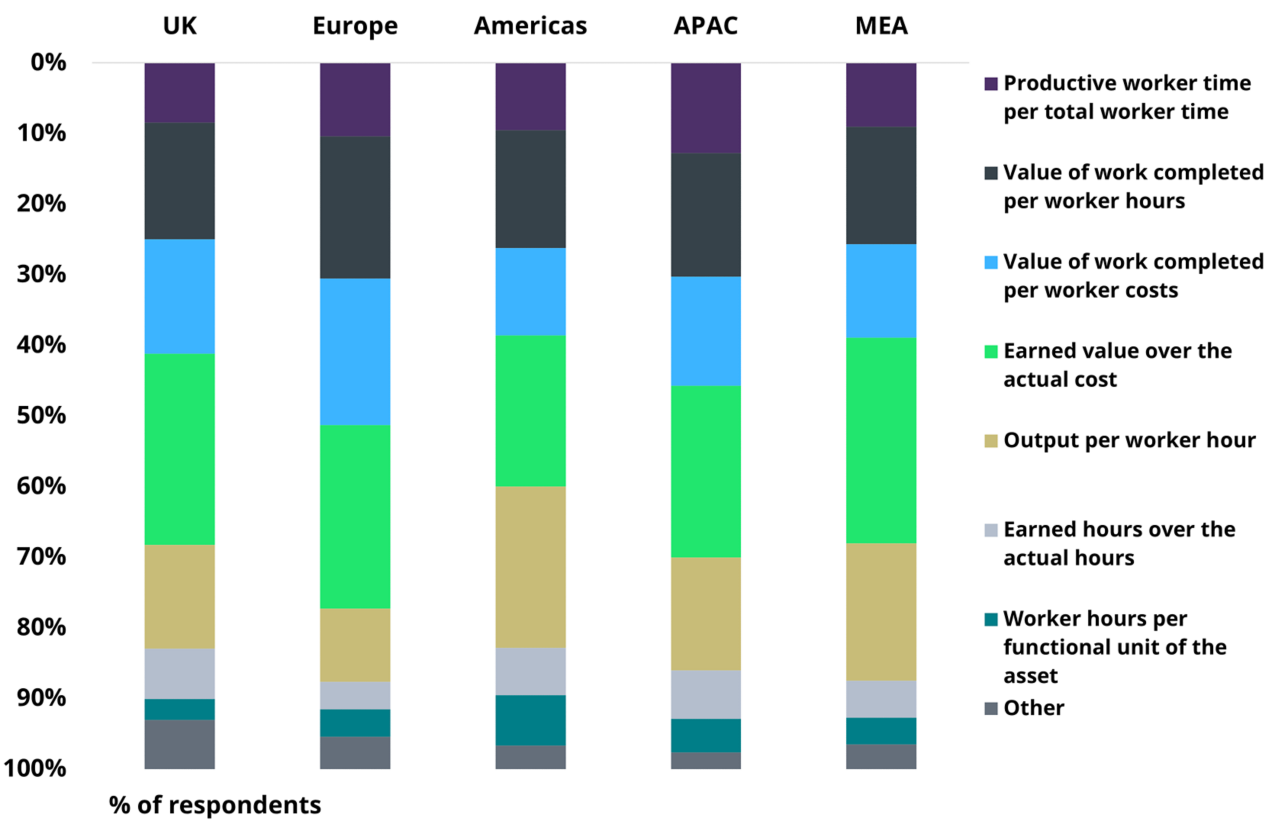
Industry benchmark adoption reinforces the point: just 5% of UK and European firms use benchmarks, rising to 9% in APAC, 14% in MEA, and 16% in the Americas. Without external reference points, the majority of firms globally have limited ability to identify performance gaps, set realistic improvement targets, or justify investment in productivity-enhancing measures. The slightly higher adoption in the Americas and MEA may reflect more mature industry association frameworks or greater competitive pressure requiring external validation of performance claims.
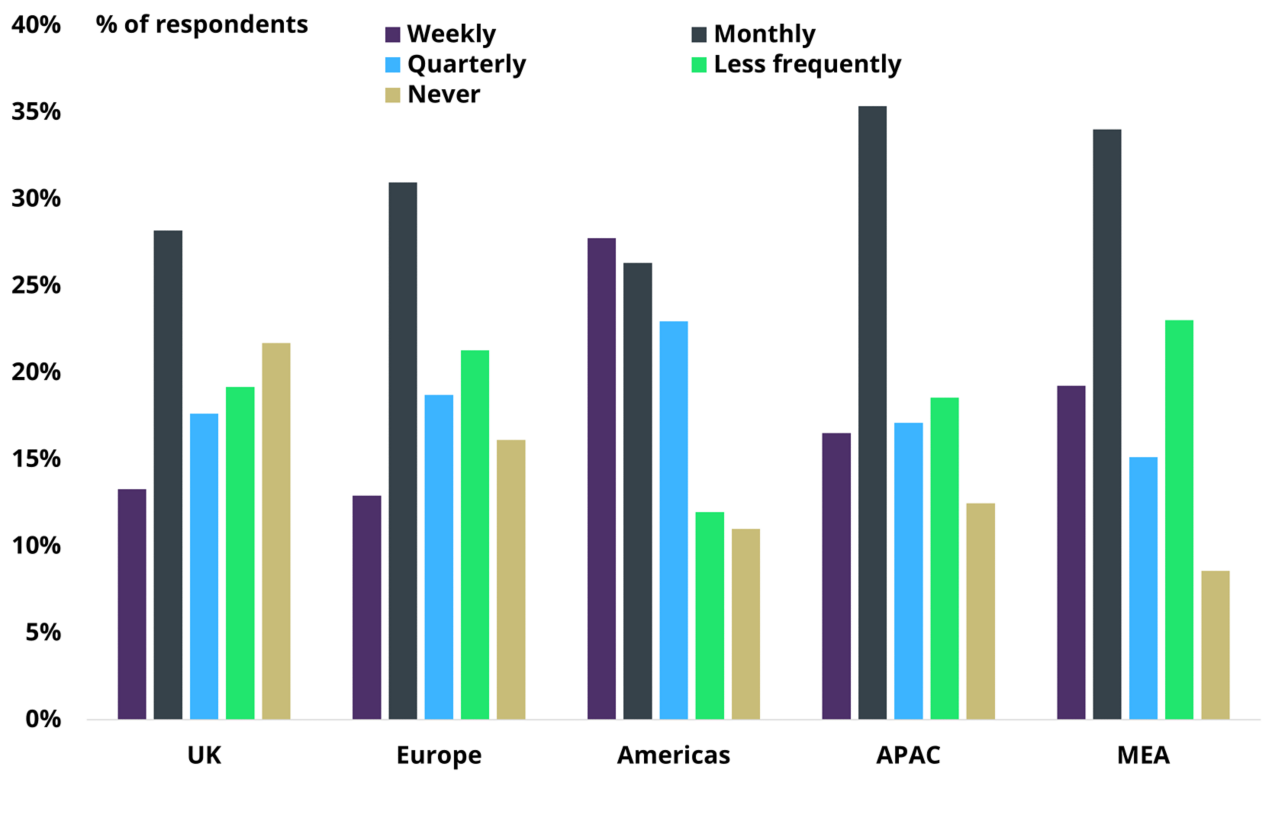
Measurement frequency
How often firms measure productivity varies sharply by region. The UK has the highest rate of firms that never measure (22%), compared with just 9% in MEA. The Americas leads on high-frequency tracking, with 28% measuring weekly and 54% at least monthly; the UK trails at 13% weekly and 42% monthly or more. The UK’s higher overall response rate and slightly greater share of smaller businesses may partly explain its weaker figures, though even adjusting for firm size, the gap between UK and Americas measurement culture is notable. Monthly measurement is the most common frequency across all regions (28–35%), likely aligned with financial reporting cycles rather than real-time productivity management. The dominance of monthly tracking suggests a missed opportunity: weekly measurement, practised by over a quarter of Americas-based firms, allows tighter feedback loops between management decisions and productivity outcomes. Compared with the 2023 survey, “never measure” rates are broadly stable, but the Americas has overtaken MEA as the region with the highest weekly measurement share.
Recent performance
Productivity performance over the past 12 months shows a positive net balance across all regions, though with significant variation. Net balances (the share reporting an increase minus the share reporting a decrease) range from +32% in MEA to +9% in APAC, with Europe at +27%, the Americas at +22%, and the UK at +18%. MEA’s strength likely reflects major infrastructure investment and younger construction sectors adopting modern methods. The UK’s relative weakness may partly reflect Brexit-related labour shortages and its higher share of smaller firms in the sample. APAC’s position is consistent with slowing growth in China and difficulties in the property sector.
Future expectations and the optimism gap
Forward-looking net balances are higher than past performance in every region. MEA rises to +54% (from +32%), the Americas jumps from +22% to +48%, and APAC moves from +9% to +38% (the largest gap of any region at 30 percentage points). Europe shows the narrowest gap, rising from +27% to +35%, while the UK moves from +18% to +34%.
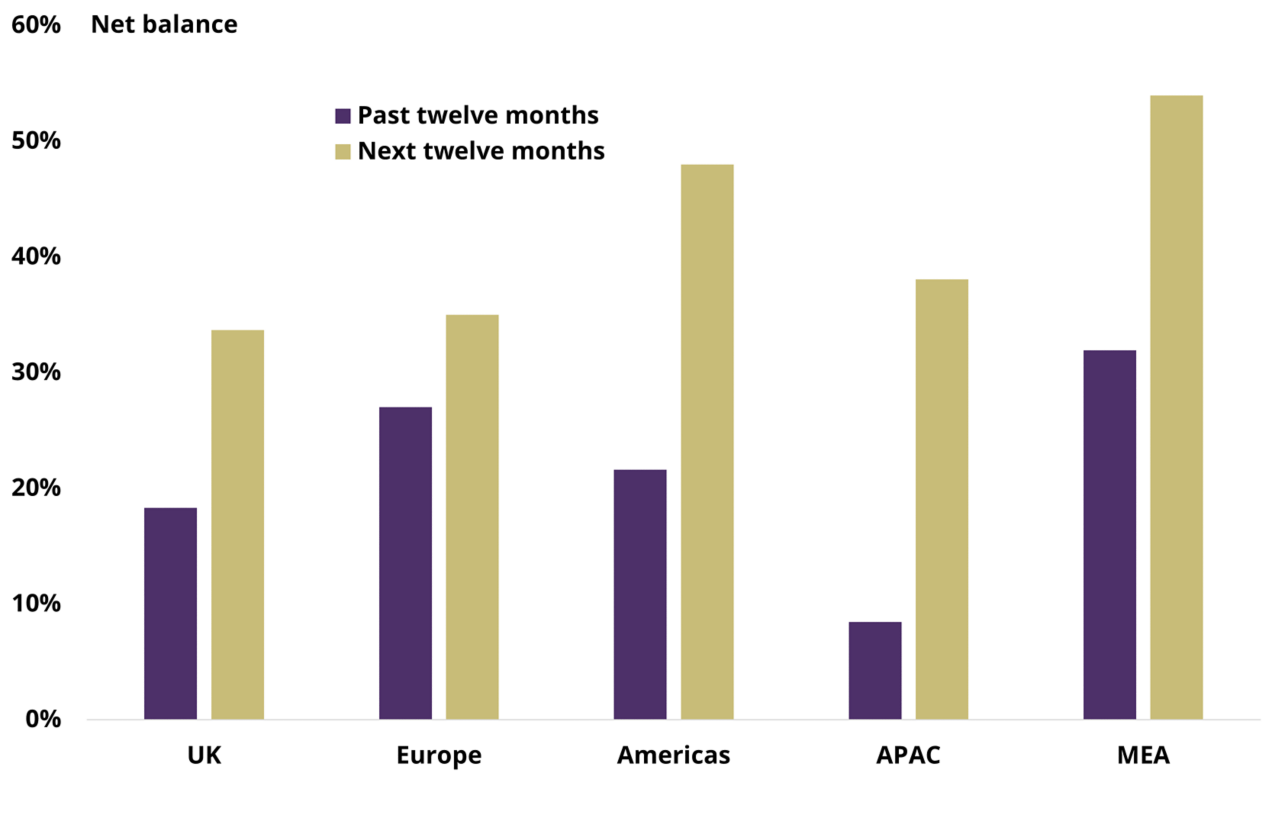
Figure 3 – Reported trends in Productivity and 12-Month Expectations
The scale of this gap deserves closer examination. Productivity forecasting has a well-documented optimism bias: the Office for Budget Responsibility (OBR), for instance, has repeatedly had to revise down its own productivity growth projections for the UK economy as a whole. Firms tend to overestimate the impact of planned changes and underestimate external headwinds, and the pattern here is consistent with that tendency. Whether the current wave of optimism reflects genuine momentum from infrastructure programmes and workforce investment, or simply the familiar tendency to expect that next year will be better, will only become clear when the 2026 data arrives.
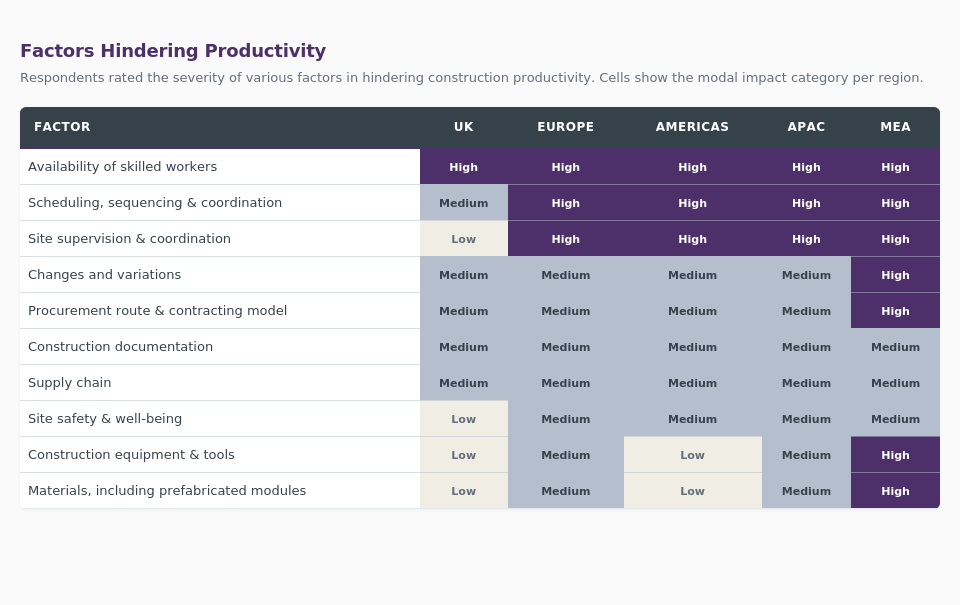
What hinders productivity?
The strongest point of agreement across the survey is that people matter most. Availability of skilled workers is the only factor rated as high impact across all five regions: MEA (59%), Europe (56%), the Americas (53%), APAC (46%), and the UK (37%). This is notable given the industry’s sustained focus on digital transformation and automation. Technology dominates conference agendas, and governments tend to fund innovation programmes more readily than sustained workforce development, yet the global industry remains clear that productivity is fundamentally a people challenge. Equipment can be purchased quickly, but skilled workforces take years to develop. Beyond labour, scheduling, sequencing and coordination is rated high impact in four of five regions, and site supervision follows a similar pattern, both pointing to management capability as a secondary but significant constraint. The interplay between these factors matters: labour shortages are compounded when site coordination is poor, and vice versa.
What would improve productivity?
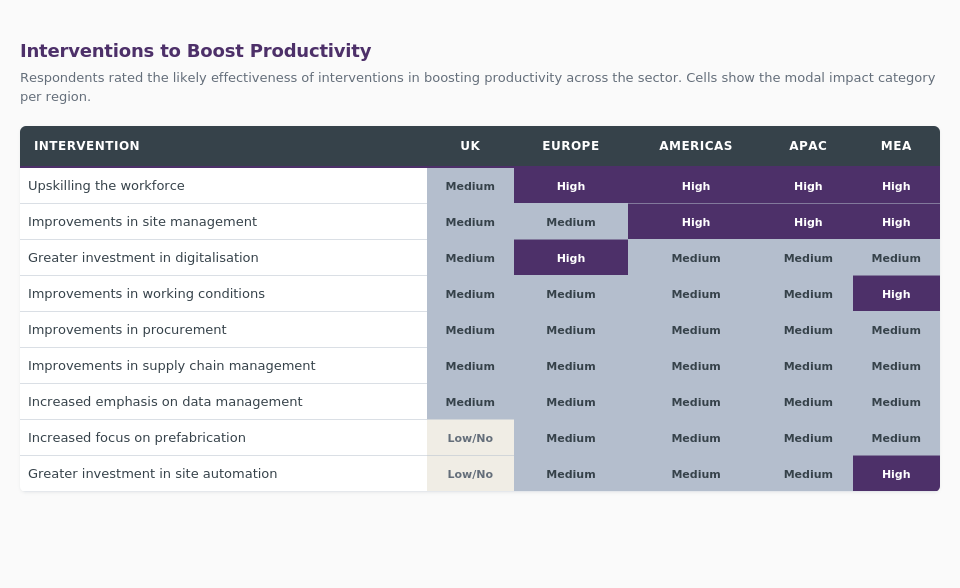
The interventions data tells the same story. Upskilling the workforce averages 47% high-impact ratings and ranks as the top intervention in four of five regions. By contrast, digitalisation and automation receive more mixed support, with particularly low confidence in the UK (17% rating automation as high impact). Across every region, people-focused measures are rated more highly than technology-led ones. Site management stands out among process measures, averaging 40% high-impact, suggesting firms value practical, controllable improvements at the project level over broader structural reform. Regionally, MEA records the highest average confidence in interventions across the board (43%), consistent with its strong recent performance. The UK is the clear outlier, with the lowest average confidence in interventions (23%) and particularly weak belief in technology-driven improvement. This may reflect hard-won experience of implementation challenges or simply a more conservative professional culture.
No single intervention is seen as transformative by more than half of respondents. The implication is that improvement will be incremental and people-centred, supported by selective technology adoption and better site-level management, rather than driven by any single solution.
Looking ahead
The global construction industry faces a productivity challenge that is as much about measurement as performance. Definitions remain fragmented, benchmark adoption is minimal, and a significant share of firms do not measure productivity at all. Where it is being tracked, the picture is cautiously positive, but forward-looking expectations consistently outstrip recent experience.
What comes through most clearly is the industry’s consensus on what drives improvement: workforce skills, identified as both the biggest barrier and the most effective intervention across every region. Sustained investment in training, skills development, and workforce planning should sit at the centre of any credible productivity strategy, supported by (but not replaced by) technology adoption. The measurement challenge is equally pressing: until the industry converges on common definitions and meaningful benchmarks, the ability to track progress, share best practice, and direct investment effectively will remain limited.
Looking ahead, artificial intelligence could change the equation. AI-driven tools for project scheduling, cost estimation, quality monitoring, and resource allocation could augment workforce productivity and help bridge the gap between ambition and delivery. However, realising these benefits will depend on responsible adoption, adequate training, and integration with existing workflows rather than wholesale replacement of human expertise. RICS has explored these themes in its AI in Construction 2025 report, and its guidance on the Responsible Use of AI provides a framework for firms seeking to adopt these technologies in a way that complements rather than undermines the people-centred approach the data so clearly supports. The next edition of this survey will test whether the industry’s current optimism translates into measurable progress.
Term |
Definition |
| Output per worker hour | Direct measurement of construction productivity calculated by dividing the units of work completed by the number of hours worked. |
Productive worker time per total worker time |
Direct construction productivity measurement by tracking non-value-adding time. This method incorporates the efficiency of construction work. |
Value of work completed per worker hours |
The value of work completed is determined by applying the percentage of physical progress achieved to the general contract or purchase order value, including any approved changes. Productivity is determined by dividing the value of work completed by the actual worker hours expended in completing the work. |
Value of work completed per worker costs |
The value of work completed (explained under the definition of ‘value of work completed per worker hours’) is divided by the actual worker costs expended in completing the work. |
Earned value over the actual cost |
Earned value (EV) is the measure of work performed, expressed in terms of the budget authorised for that work. Construction productivity is calculated by dividing the EV by the money spent to accomplish the progress. |
Earned hours over the actual hours |
EV is the measure of work performed, expressed in terms of the budget authorised for that work. Construction productivity is calculated by dividing the EV by the actual worker hours to accomplish the progress. |
Worker hours per functional unit of the asset |
A functional unit is a unit of measurement used to represent the prime use of an asset or part of an asset (e.g., per bed space, per house, per kilometre, per highway lane, or per square metre of retail area). Construction productivity is calculated as the hours to complete the selected functional unit. |