BCIS Quarterly briefing – five year forecast, July 2020
-
 Email
Email
-
 Facebook
-
 Linkedin
-
 Twitter
-
 Whatsapp
20 August 2020
Summary of Forecasts
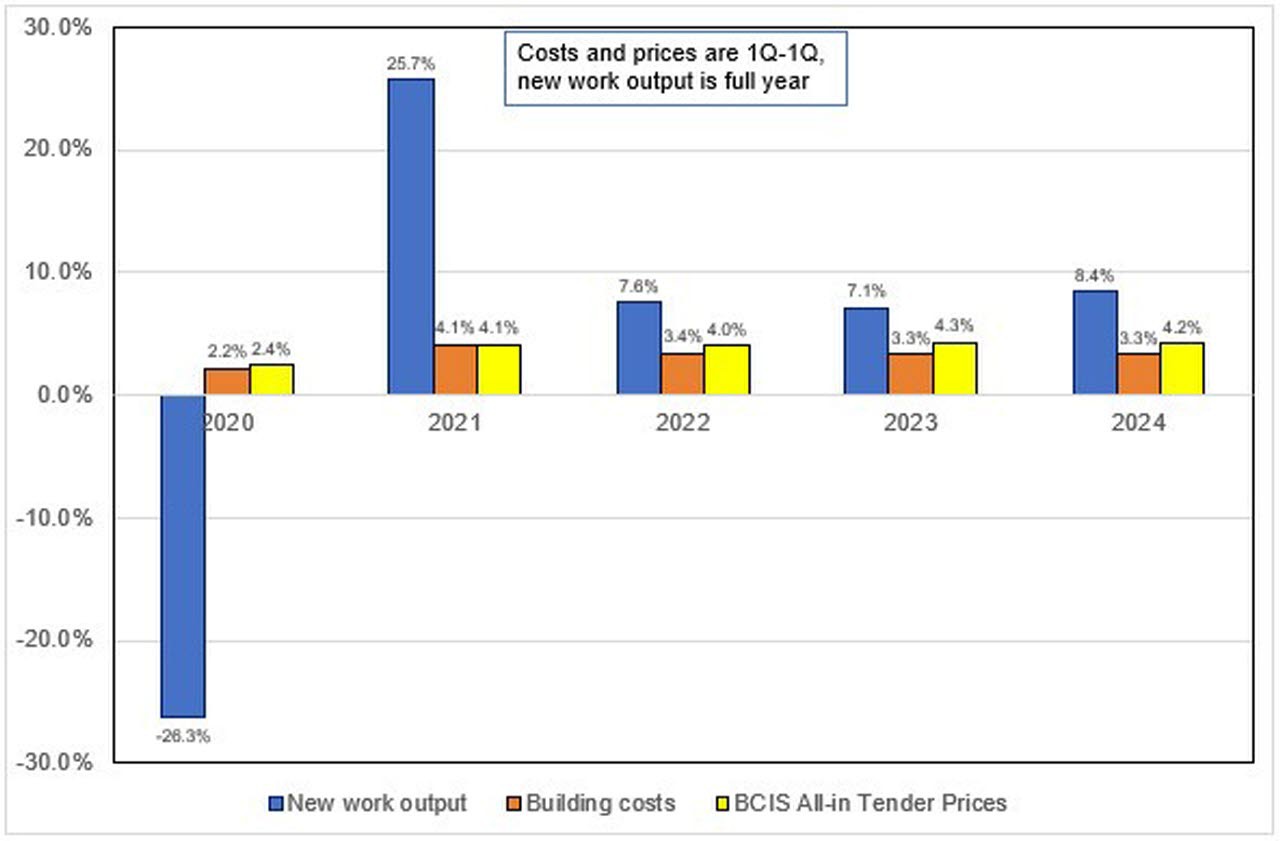
Figure 1: New work output, building costs and tender prices
Central scenario
Current market
- Tender prices in 1st quarter 2020 rose by 0.3% compared with the previous quarter, but remained unchanged compared with a year earlier
- Materials prices fell by 0.3% in 1st quarter 2020 compared with the final quarter of 2019, and by 0.7% compared with the same quarter in 2019
- Building costs fell by 0.3% in 1st quarter 2020 on a quarterly basis, but rose by an annual 1.1%
- New work output fell by 1% in 1st quarter 2020 compared with the previous quarter, and by 2% compared with a year earlier. In April 2020 new work output fell by 41% on a monthly basis and by 45% on an annual basis. In May 2020 new work output rose by 11% in May 2020 compared with the previous month, but fell by 39% compared with the same month in 2019.
- In the UK, GDP shrank by 19.1% in the three months to May 2020 compared with the previous three months and decreased by 18.6% compared with the same period a year earlier
- General inflation rose by 1.1% in the year to May 2020, The Consumer Prices Index rose by 0.6% over the same period
- The Bank of England base rate stands at 0.1%
- Stirling exchange rates against the Euro stand at around 1.10, and against the US Dollar at 1.25, around 15% below those prior to the EU Referendum
Forecast
Over the forecast period (1st quarter 2020 to 1st quarter 2025):
- new construction output will rise by 16%
- costs will rise by 17%
- tender prices will rise by 21%
- UK GDP will fall sharply in 2020 as a result of the Covid-19 crisis, with a bounce back in 2021. GDP is then expected to grow by under 3% per annum over the remainder of the forecast period.
- the annual general inflation rate is likely to be low in 2020, then rising by around 2% to 3% per annum over the remainder of the forecast period.
- interest rates will rise gradually to 1.5% in 2024
- sterling exchange rates will remain depressed for the period of the Brexit negotiations
- the main risks to materials prices will be difficulty in obtaining materials during the Covid-19 crisis, oil prices, tariffs on imports and sterling exchange rates
- nationally agreed wage awards are unlikely to increase over the next year, but will be affected by restrictions in the availability of European labour from 2021
- the Covid-19 virus crisis will dampen world demand
- it is assumed that there will not be a significant second wave of Covid-19 and
- the forecast is based on information available up to 20 July 2020,
The central scenario is based on the following assumptions. The Covid-19 crisis will lead to a sharp fall in new work output from March 2020 to November 2020 with a rebound after that. The Brexit transitional period will end on 31 December. During the transitional period, the UK continues to make payments to the EU (which will be deducted from the final 'divorce bill'). It is assumed that relatively few trade agreements will be made during the remainder of the transitional period, and that these and any subsequent agreements are less favourable than before the EU Referendum. Sterling exchange rates are expected to remain depressed until around the midpoint of the forecast period, improving gradually thereafter. Free movement of labour continues to the end of the transitional period, with restrictions in movement after that. It is assumed that it remains desirable for EU workers to work in the UK and that demand for construction operatives in the EU remains unchanged. GDP recovers slowly during the second half of the forecast period as confidence returns.
Alternative Brexit scenarios
The Covid-19 crisis has overshadowed the UK leaving the EU but it is still happening. Even though the UK has left the EU with an agreement, there will still be a large number of unknowns to be sorted out during a very short transitional period, ending at the end of 2020.
While almost any outcome is still possible, BCIS will continue to produce forecasts based on three scenarios: a central scenario, an upside scenario and a downside scenario. These reflect the different outcomes from the exit negotiations from the EU and are still equally likely. The uncertainty of the results of the Covid-19 crisis and the Brexit negotiations will undoubtedly lead to BCIS revising its assumptions again as more is known.
In all scenarios, it is assumed that there will be no change of UK government over the forecast period and that there is political stability in the rest of the world. A gradual rise in interest rates puts pressure on consumer spending.
BCIS has looked at two alternative scenarios:
- An upside scenario is based on the following assumptions. The effects of the Covid-19 crisis is assumed to be a little less harsh than the central scenario. The Brexit transitional period ends on 31 December 2020. During the transitional period, the UK continues to make payments to the EU (which will be deducted from the final 'divorce bill'). Negotiations run a lot smoother than with the central scenario, providing investors with greater clarity at an earlier stage. It is assumed that by midway through the forecast period, any trade agreements with the EU will be close to those before the EU Referendum, and those with the rest of the world will boost the UK economy. Sterling exchange rates are expected to remain depressed until the middle of the forecast period, then return to pre-EU Referendum levels, with a consequential reduction in imported materials prices. Free movement of labour continues to the end of the transitional period, with an exemption on movement of European operatives in the construction industry thereafter. It is assumed that it remains desirable for EU workers to work in the UK, and that demand for construction operatives in the EU remains unchanged. It is assumed that there is not a significant second wave of Covid-19. The economy picks up over the second half of the forecast period as confidence returns.
- A downside scenario assumes that the effect of the Covid-19 crisis will impact on new work output by an additional three months compared with the central scenario. In addition, there will be a 'no deal' at the end of the Brexit transitional period in December 2020. It is assumed that following the transitional period, World Trade Organisation tariffs will apply to construction materials imported from the EU, any subsequent trade agreements with the EU are a lot less favourable than before the EU Referendum and there are restrictions on the movement of labour. It is assumed that sterling exchange rates fall towards parity, only improving towards the end of the forecast period, which also adversely affects the price of imported materials and the desire of EU construction workers to work in the UK. The UK starts paying a 'divorce bill' from 1st quarter 2021. The economy goes into recession in 2020 as a result of the Covid-19 crisis with a bounce back to some extent in 2021, but then returns to recession, only recovering at the end of the forecast period. It is assumed that there is not a significant second wave of Covid-19.
Upside forecast: over the forecast period (1st quarter 2020 to 1st quarter 2025)
- new work construction output will rise by 20%
- costs will rise by 17% and
- tender prices will rise by 22%.
Downside forecast: over the forecast period (1st quarter 2020 to 1st quarter 2025)
- new work construction output will fall by 14%
- costs will rise by 21% and
- tender prices will rise by 2%.
Risks to the forecast - Covid-19
|
Direction of risk |
||
|
New work output |
Building costs |
Tender prices |
Extended length of disruption |
Downward |
- |
Downward |
Further site closures |
Downward |
- |
Downward |
Reduced labour availability |
Downward |
Upward |
Upward |
Further delay to projects |
Downward |
- |
Downward |
Cancelled projects |
Downward |
Downward |
Downward |
Materials not available as further works and factories shut down |
Downward |
Upward |
Upward |
Further materials unable to be delivered from abroad |
Downward |
Upward |
Upward |
Loss of capacity |
Downward |
- |
Downward |
Investors stop spending money |
Downward |
Downward |
Downward |
Significant second wave of Covid-19 |
Downward |
- |
Downward |
Public sector resources earmarked for construction investment diverted to deal with crisis. |
Downward |
Downward |
Downward |
Summary of forecasts
Table 1: Summary of forecasts
New work output at constant prices 2016
|
Percentage change |
||||
|
1Q2020 to 1Q2021 |
1Q2021 to 1Q2022 |
1Q2022 to 1Q2023 |
1Q2023 to 1Q2024 |
1Q2024 to 1Q2025 |
Central scenario |
|
|
|
|
|
TPI |
+2.4 |
+4.1 |
+4.0 |
+4.3 |
+4.2 |
GBCI |
+2.2 |
+4.1 |
+3.4 |
+3.3 |
+3.2 |
New work output * |
-26.3 (2020) |
+25.7 (2021) |
+7.6 (2022) |
+7.1 (2023) |
+8.4 (2024) |
Upside scenario |
|
|
|
|
|
TPI |
+2.4 |
+4.1 |
+4.2 |
+4.6 |
+4.9 |
GBCI |
+2.5 |
+3.3 |
+3.7 |
+3.5 |
+3.2 |
New work output * |
-22.3 (2020) |
+23.0 (2021) |
+7.8 (2022) |
+7.9 (2023) |
+8.2 (2024) |
Downside scenario |
|
|
|
|
|
TPI |
-0.9 |
-5.8 |
+0.6 |
+3.8 |
+4.9 |
GBCI |
+2.5 |
+4.9 |
+4.1 |
+4.0 |
+4.1 |
New work output * |
-30.7 (2020) |
+14.5 (2021) |
-6.2 (2022) |
+6.6 (2023) |
+8.5 (2024) |
* BCIS forecast of new work output at constant prices 2016
Figure 2: All-in Tender Price Index – annual percentage change

Source: BCIS
BCIS Forecasts
1 Forecasts
BCIS is publishing the central scenario as the forecast for the price and cost indices, but it should be borne in mind that each forecast is equally possible.
1.1 The central scenario
1.1.1 Construction demand (output)
The BCIS econometric model, prepared by Oxford Economics (OE), shows that total new work output will fall by 23% in 2020, and then rise by 25% in 2021. In 2022 a rise of 11% is expected by OE, and then rises of 3% to 4% over the following two years. The forecast for total construction output shows it following a similar trend. This was prepared before the Covid-19 crisis took hold.
Table 2: Construction output forecast – BCIS econometric model
Percentage change at constant prices
Year on year |
Forecast |
|
Total new work output |
Total output |
|
2020 |
-22.6% |
-23.1% |
2021 |
+25.0% |
+23.7% |
2022 |
+10.8% |
+11.8% |
2023 |
+4.3% |
+4.2% |
2024 |
+3.2% |
+2.9% |
Source: OE (Jul 20)
The model is based on historical relationships and does not take into account foreknowledge of projects that have been announced.
The BCIS assumptions about new work output are similar to those in the BCIS econometric model over the first three years of the forecast period but are stronger over the final two years.
The Prime Minister announced at the end of June 2020 that a root to getting the UK economy going again will be by investment in building and infrastructure. He announced £50 billion of funding for projects in the pipeline would be brought forward to begin in 2020 or 2021.This included the following, a fair proportion of which will be classified as refurbishment or maintenance:
- £1.5 billion for hospitals this year for hospital maintenance.
- £100 million this year for 29 projects in the road network, from bridge repairs in Sandwell to boosting the quality of the A15 in the Humber region. In addition, £10 million will be made available for development work to unblock the Manchester bottleneck which will begin this year.
- Over £1 billion will fund the first 50 projects of a new, ten-year school rebuilding programme, starting from 2020 through to 2021.The projects will be confirmed in the Autumn, and construction will begin on the first sites in September 2021.
- £560 million investment for repairs and £200 million for upgrades to schools and colleges this year.
- £142 million of investment for digital upgrades and maintenance to approximately 100 court building this year, £83 million for maintenance of prisons and youth offender facilities, and £60 million for temporary prison places.
- £900 million of investment for a range of 'shovel ready' local growth projects in England 2020 and 2021, as well as £96 million to accelerate investment in town centres through the Towns Fund this year. This will provide all 101 towns selected for town deals with £500,000 to £1 million to spend on projects like improvement to parks, high streets and transport.
- The government also intends to bring forward funding to accelerate infrastructure projects in Scotland, Wales and Northern Ireland. The government will work with the devolved administrations to identify where 'shovel ready' projects are, build our communities, and look at how best to improve road, rail, air and sea links between the four nations to create a more connected kingdom.
Also announced by the Prime Minister at the end of June 2020 were radical reforms to the planning system, which come into force in September 2020.
The changes include:
- More types of commercial property having total flexibility to be repurposed through reform of the Use Classes Order. For example, a building used for retail would be able to be permanently used as a cafe or office without requiring a planning application and local authority approval. However, pubs, libraries and other types of uses essential to the local communities will not be covered by these changes.
- A wider range of commercial buildings will be allowed to change to residential use without the need for a planning application.
- Builders will no longer require a normal planning application to demolish and rebuild vacant and redundant residential or commercial buildings if they are to be rebuilt as homes.
- Property owners will be able to build additional space above their properties via a fast track approval process, subject to neighbour consultation.
Despite leaving the EU at the end of January 2020, it is thought that with the transition period being so short and ending at the end of December 2020, a great deal of uncertainty still exists over the years ahead for both the whole economy and the construction industry.
According to Glenigans, work is currently suspended on 9% of construction sites in England, 12% in Wales, 49% in Northern Ireland, and 71% in Scotland. However, they also report that more sites are reopening in the upcoming weeks.
It is now clear that the Covid-19 crisis will significantly affect construction industry output. It has been assumed that this will take the form of a short sharp shock now affecting new work output from March to mid-November, three months longer than BCIS assumed in April 2020, after which there will be a bounce back in output. This will lead to all new work sectors having significant falls in output in 2020 as a whole, with a significant upturn in 2021, mostly to do with the large fall in 2020. Overall, new work output is forecast to be 12% lower in 2024 than was reported by BCIS in January 2020. It is assumed that there will not be a significant second wave in the Covid-19 crisis.
Figure 3: Comparison of July 2020 and January 2020 BCIS forecasts of new work output

Source: BCIS, ONS
It is assumed that the downgrading will be across all sectors . All sectors will have suffered as a result of closed sites and labour availability on sites that remained open. All open sites are now social distancing in accordance with the recent CLC publication Working Safely During COVID-19 in Construction and Other Outdoor Work (version 5), Private sector projects are likely to be delayed or cancelled even after the Covid-19 crisis subsides. The Chancellor announced in the Budget a £350bn package to help businesses and individuals get through the worst of the Covid-19 outbreak. Further significant sums have been announced since. Although this is a significant sum, the risk for the construction industry is that part or all of this is funded from cuts in public investment in construction (although the current government stance suggests this is unlikely), but, no allowance has been made for this in the forecasts below.
Figure 4: Short term forecast of alternative new work scenarios

Source: BCIS, ONS
New work output in 2020 is anticipated to fall by around 26%. New work output then bounces back in 2021 by 26%, before growth slows to around an annual 6% to 7% over the last three years of the forecast period, with the infrastructure sector being the main contributor to growth, aided by growth in the remaining sectors. New work output only returns to 2019 levels by 2022.
Public housing
In the Autumn Budget 2017, the government included a number of medium to long-term measures to promote house building. These include planning reforms, increased densities in urban areas and plans for five new garden cities.
The following was included in the recent Budget to aid housebuilding:
There will be a boost of £10.9 billion in housing investment to support the commitment to build at least 1 million new homes by the end of the Parliament, and an average of 300,000 homes a year by the mid-2020s. However, this target looks unlikely to be met, based on current housebuilding levels.
There will be an additional £12.2 billion for the Affordable Homes Programme. Included in this programme will be a 1,500 unit pilot of 'First Homes' houses to be sold to first time buyers at a 30% discount which will remain in perpetuity, keeping them affordable for years to come. There was also £400 million for ambitious mayoral combined authorities and local areas to establish housing on brownfield land across the country.
The Budget also confirms allocations from the Housing Infrastructure Fund totalling £1.1 billion (already included previously) for nine different areas including Manchester, South Sunderland and South Lancaster.
To further enable high quality investment by local authorities, the government is cutting the interest rates for investment in social housing by 1%, and making an extra £1.15 billion of discounted loans available for local infrastructure projects.
Output is now set to fall by over 40% in 2020, but rise by a similar amount in 2021. Growth over the remainder of the forecast period is expected to be 6% to 7% per annum. However, it should be borne in mind that this is a very small sector, and relatively small changes can result in quite high percentage changes.
ONS is likely to record a significant proportion of public housing as private housing, as they will be built by private housebuilders as part of larger schemes through Section 106 agreements and the Shared Ownership Affordable Homes Programme 2016 to 2021. As such, it is better to look at total housing output, which follows a similar profile to that of private housing due to most of the provision falling within the private housing sector.
Private housing
Output is expected to fall by 41% in 2020 followed by growth of around 38% in 2021. Growth then settles to around 10% per annum over the remainder of the forecast period, based on an attempt to get nearer to the government's target for 2025. Until recently, a key driver of growth has been that demand outweighed supply, with a theoretical need for an annual average 250,000 new homes over the next five years. This is based on MHCLG's estimates for the number of new households. The level of housing starts was 192,000 per annum, prior to the Covid-19 crisis. However, Covid-19 will have severely damaged consumer confidence, and sharply rising unemployment in the near term will dampen demand, and are likely to lead to falling house prices. There are various government initiatives to encourage housebuilders to build more houses such as the Help to Buy scheme, but the qualification for this is to be tightened in March 2021 to first-time buyers and purchase prices will be subject to regional house price caps. The Housing Infrastructure Fund (HIF) is also designed to increase house building by unblocking sites suffering from the lack of infrastructure funding to open them up. The HIF is worth £5.5bn and is expected to unlock up to 650,000 new homes between 2018/19 and 2023/24.
There are a number of other factors suppressing demand. Consumer confidence will also be dampend by the uncertainty over what will happen when the UK leaves Europe at the end of the year. Furthermore, the government also brought in mortgage lending restrictions designed to prevent another house price bubble, the consequence of which is likely to restrict demand.
Measures included in the Autumn Budget 2017 and Budget 2020 to promote housing apply equally to this sector.
Infrastructure
New infrastructure output is expected to fall by 10% in 2020 as a result of the Covid-19 lockdown, with a very sharp bounce back in 2021 in the order of 25%, followed by strong growth over the remainder of the forecast period. Key drivers of growth will be the roads subsector, through the National Roads Fund; the rail sector, with the new control period starting in 2019 and work on HS2 building up; and the electricity subsector, through nuclear new build. Some additional investment has been included over the second half of the forecast period in flood defences, rail (Northern Powerhouse Rail and Midlands Hub) and roads, as an estimate of work included in the Budget 2020. It is assumed, however, that most of the promised expenditure will fall outside the forecast period. More detail should follow in the government's Spending review and an update of the National Infrastructure and Construction Pipeline, both due at some time later in the year. Some work is being brought forward by the government to start this year, as described above.
Public non-housing
Output now stands at approximately 40% below the previous peak in 2010. In 2020 a fall of around 16% will be followed by a similar sized increase in 2021. This is from a very low base. Over the final three years of the forecast period, output is set to grow by 12% in 2022, then slowing to 7% per annum by the end of the forecast period. Growth is anticipated to come from the education subsector through phase two of the Priority School Building Programme (including the 50 new schools starting next year) and non-PFI health schemes through Procure 21+, Procure 22, and the new Procure 2020. Growth will also be supported by two hospital projects previously being carried out by Carillion under PFI, and work required for the 2022 Commonwealth Games in Birmingham.
Private industrial
Output is expected to fall by around 20% in 2020 with a bounce back of growth of over 30% over the following year. Growth then slows to around 5% per annum over the remainder of the forecast period. The warehousing subsector is likely to be a key driver of growth, with even more consumers moving away from the high street to internet shopping since the Covid-19 crisis, resulting in increasing demand for online retail warehousing and logistics warehousing. The factory subsector is not expected to fare as well, with some factory schemes delayed until there is more certainty over what will happen after the UK leaves Europe at the end of the year, and viability following Covid-19. However, there are a couple of large scale factory schemes due for completion in 2020, such as the £1 billion Jaguar Land Rover retrofit to allow the production of electric vehicles, and Forterra's £95m new brick manufacturing factory already underway and due for completion in 2022, although both these projects will be hampered by reduced productivity on site, at least in the short term. The brick factory will be the largest of its kind in Europe when completed. Compared with prior to the EU Referendum, imports will be more expensive, but exports will be cheaper in real terms.
Private commercial
Output is forecast to continue falling in 2020, by 22%, then rise by 15% in 2021. Growth then remains unchanged in 2022, before growth of 3% in 2023 and 6% in 2024. Output in 2024 will still be in the order of 25% below the previous peak in 2008. This sector was already under downward pressure from the continued uncertainty for clients about leaving Europe. However, there is likely to be additional delays and cancellation of projects as a result of the Covid-19 crisis, with a number of businesses going into bankruptcy, and consumers having less to spend. Future investment is likely to be reduced or put on hold, particularly in the offices, retail and entertainment subsectors. Demand for new office building in city centres may well be affected by changing work patterns, with a greater number of staff working from home, and companies reducing their office space requirements. In the retail subsector, more consumers are likely to continue their habit during lockdown of internet shopping, and many cafes, restaurants and the like will have gone out of business or be unable to run profitably whilst social distancing continues.
It is assumed that planned investment in private finance initiatives (PFI) education and health projects will be unchanged, but in the 2018 Budget, the chancellor announced that the use of PFIs will be abolished, and only existing contracts procured via the PFI route will remain. This may lead to more work being classified by ONS as public non-housing output.
Table 3: BCIS new work output assumptions
Annual percentage change at constant prices
Year on year |
Forecast |
2020 |
-26.3% |
2021 |
+25.7% |
2022 |
+7.6% |
2023 |
+7.1% |
2024 |
+8.4% |
Source: BCIS
1.1.2 Costs
1.1.2.1 Materials
The BCIS Materials Cost Index shows that, provisionally, materials prices fell by 0.3% in 1st quarter 2020, compared with the previous quarter, and by 0.7% compared with a year early.
Sterling exchange rates remain depressed compared with the pre-EU Referendum rates. It is assumed that exchange rates will stay depressed until around the midpoint of the forecast period, improving gradually thereafter. As they improve, prices for imported materials will fall.
OE show that overall raw materials prices will fall by 1% in the year to 1st quarter 2021. Over the next four years of the forecast period, prices are expected to rise between 2% and 3% per annum.
OE also forecast the commodity prices for individual metals, as shown in Table 14 .
Based on data published by the ONS, the cost of steel reinforcement rose by an average of 10% per annum between 2000 and 2010, but generally fell from late 2011 through to early 2016 in the order of 40%. Since then, prices have risen by around 40%. Prices remain around 16% below the previous peak in 2011. In 1st quarter 2020 steel reinforcement fell by 11% on an annual basis. According to the International Steel Statistics Bureau, around 80% of the steel imported into the UK was imported from Europe in 2018 and around 20% from Asia and other countries. Around 60% of the steel used in the UK is imported, according to UK Steel.
OE show steel prices falling by an annual 3% in 1st quarter 2020, rising by 5% over the following year, then rise by between 1% and 2% over each of the final three years of the forecast period.
Steel reinforcement prices are expected by BCIS to rise by 2% in the year to 1st quarter 2021, then rise by around 3% per annum over the remainder of the forecast period.
European Brent crude oil prices fell by 19% in 1st quarter 2020 compared with the previous quarter, and by 18% compared with a year earlier. Oil prices in 1st quarter 2021 stood at around US$51.Over the quarter, prices fell from US$64 in January 2020 to US$34 in March. This was principally as a result of the Covid-19 outbreak which is currently dampening demand, and the lack of agreement between Saudi Arabia and Russia over the sharp reduction of production. In response, Saudi Arabia slashed its oil prices, sending them tumbling. Recently, OPEC+ members including Saudi Arabia and Russia reached a preliminary deal to cut oil output. The deal is to cut oil production by 10 million barrels per day for two months starting on 1 May 2020, then 8 million barrels a day from July to December and 6 million barrels per day from January 2021 to April 2022. This was reconfirmed in the OPEC+ meeting in June 2020. However, OPEC+ will be meeting monthly throughout the remainder of the year to assess if any adjustments need to be made to oil production quotas. Anecdotally, OPEC+ are looking to maintain oil prices below $50 a barrel to prevent the resurgence of US shale oil producers. In April 2020, oil prices fell to just US$18, before rising to US$27 in May, and rising sharply to US$40 in June.
OE are forecasting a fall in oil prices of 4% in the year to 1st quarter 2021, and by 1% over the following year, then rising by 9% in the year to 1st quarter 2023, and then rising by around 6% per annum over the final two years of the forecast period. With the rate of sterling against the US dollar falling currently, some upward pressure will be applied to oil prices in UK construction.
If oil prices remain low for any length of time, this could result in the closure of a number of shale oil producers.
Upward pressure on oil prices can come from many different sources, including political tensions, particularly in the Middle East. There is potential for a turbulent ride for oil prices over the coming months with heightened political tensions in the Middle East, but currently BCIS has assumed that market forces will restrict significant upward movement above US$70 (although this currently looks unlikely), although prices might spike before falling back, depending on how reactive the market is.
The BCIS forecast for oil prices in construction shows prices falling by 3% over the first year of the forecast period, followed by an 8% rise over the following year. Over the final three years of the forecast period, prices are expected to rise by 5%, 3% and 3% respectively.
Table 4: Forecast of commodity prices of metals – annual percentage change
|
1Q2020 to 1Q2021 |
1Q2021 to 1Q2022 |
1Q2023 to 1Q2023 |
1Q2023 to 1Q2024 |
1Q2024 to 1Q2025 |
Aluminium |
-6.6 |
+2.0 |
+2.0 |
+2.0 |
+2.0 |
Copper |
-3.2 |
+8.2 |
+7.0 |
+4.1 |
+4.1 |
Iron ore |
-15.2 |
-15.6 |
-6.1 |
+3.4 |
+3.1 |
Lead |
+0.5 |
+3.0 |
0.1 |
+0.8 |
+2.3 |
Zinc |
+4.7 |
+7.2 |
+2.0 |
+2.0 |
+2.0 |
Source: OE Aug19
In the remainder of 2020, materials price changes will be influenced by downward pressure from falling raw materials, but upward pressure as a result of some factories closing down and some difficulty obtaining imported materials.
Materials prices are anticipated to rise sharply in 1st quarter 2021 rising by an annual 4.9% on the assumption that few if any trade deals will have been agreed and consequently increased tariffs will be applied to imported materials. It is assumed that tariffs on imported materials will be applied from the end of the transitional period, but imports only represent 15% to 20% of construction materials in the UK construction industry according to the ONS. According to the CBI, average tariffs amount to 5.7% on imports and average non-tariff barriers (red tape at borders, etc.) amount to a further 6.5% on costs. Of course, on a project-by-project basis, the effect of tariffs could be greater if a larger percentage of construction materials are imported.
Materials prices are then expected to rise by an annual 3% to 4% over each of the remaining years of the forecast period, as a result of trade deals being made, as time goes on, and upward pressure as demand increases. Any increases above that allowed for tariffs in the materials cost index will be picked up in the BCIS Market Conditions Factor. The sharp growth rates seen in some of the emerging economies before the recession are not expected to return over the forecast period and therefore are unlikely to put significant upward pressure on materials prices.
Figure 6: BRICS and world economies real GDP - Annual percentage change

Source: BCIS, ONS
Table 5: BCIS forecast of construction materials prices
Period |
Forecast |
1Q2020 to 1Q2021 |
+4.9% |
1Q2021 to 1Q2022 |
+4.0% |
1Q2022 to 1Q2023 |
+3.2% |
1Q2023 to 1Q2024 |
+3.1% |
1Q2024 to 1Q2025 |
+3.9% |
Source: BCIS
1.1.2.2 Labour
The Brexit transitional period will now end at the end of December 2020, as stated in the Brexit withdrawal legislation, and can no longer be extended. BCIS is assuming that there will initially be restrictions on the movement of labour after the end of the transitional period and that this will impinge on the construction industry from around 1st quarter 2021 as the supply of new European labour dries up. This will put upward pressure on promulgated wage awards as they try to keep pace with higher site rates obtained due to the reduced labour pool. This has been included in the BCIS forecast, but this situation may be mitigated to some extent, by UK construction labour laid off as a result of the Covid-19 crisis, who haven't been re-employed.
Site rates over and above promulgated rates will be reflected in the market conditions factor, putting upward pressure on tender prices. It is assumed that by the latter part of the forecast period, the situation will improve if demand for construction operatives leads to the inclusion in the proposed Australian point-based immigration system.
In a recent BCIS survey, contractors were asked for an estimate of non-UK site labour used on UK based projects. The median percentage was 40% but the range was from 0 to 95%.
With the Covid-19 crisis continuing, it has been assumed that there will be no increases in promulgated rates of the major trade bodies in England and Wales over the next year, even for those with an agreed increase due in this period. However, builders under the BATJIC agreement have received a 3.0% increase from 22 June 2020, and the Scottish Plumbers increase from July 2020 has been temporarily postponed pending the outcome of the Covid-19 crisis. Negotiations for builders working under the CIJC agreement, with an award due in June 2020, have similarly been delayed.
it is anticipated that the average of wage awards will be around 0.5% in the year to 1st quarter 2021, rising by 4% per annum over the following two years, and by 3% per annum over the final two years of the forecast.
Table 6: BCIS forecast of wage settlements
Period |
Forecast |
1Q2020 to 1Q2021 |
+0.4% |
1Q2021 to 1Q2022 |
+3.9% |
1Q2022 to 1Q2023 |
+3.6% |
1Q2023 to 1Q2024 |
+3.0% |
1Q2024 to 1Q2025 |
+3.0% |
Source: BCIS
1.1.2.3 Building costs
Building costs are expected to rise by 2% in the year to 1st quarter 2021, then by 4% over the following year, rising by 3% per annum over the final three years of the forecast period.
Table 7: BCIS forecast of building costs
Period |
Forecast |
1Q2020 to 1Q2021 |
+2.2% |
1Q2021 to 1Q2022 |
+4.1% |
1Q2022 to 1Q2023 |
+3.4% |
1Q2023 to 1Q2024 |
+3.3% |
1Q2024 to 1Q2025 |
+3.2% |
Source: BCIS
1.1.3 Tender prices
Despite the assumption that now the effect of Covid-19 will have a short sharp shock on new work output from March 2020 until November 2020, it is not expected that tender prices will fall in 2020, rather remain fairly flat over the remainder of the year. Normally, a fall in new work output of the size forecast in 2020 would lead to falling tender prices, but with the additional costs of following the CLC Working Safely During COVID-19 in Construction and Other Outdoor Work (version 5), that the fall in output is to be short lived, and contractors significantly reducing their staffing requirements or going into liquidation, is enough to keep tender price changes entering negative changes.
With the end of the Brexit transitional period in December 2020, increased costs of tariffs from 1st quarter 2021, tender prices are expected to rise by 2.4% over the year to 1st quarter 2021. From 2nd quarter 2021, it is assumed that the full cost of social distancing on site will be included in tenders, and by 4th quarter 2021, it is assumed that social distancing is no longer required. Over the second year of the forecast period, tender prices are anticipated to rise by 4.1%, in line with input cost increases, which include some of the cost of labour as a result of the restriction on foreign labour from Europe from 1st quarter 2021. However, as stated earlier, this situation may be mitigated to some extent, by UK construction labour laid off as a result of the Covid-19 crisis, who haven't been re-employed.
Demand continues to rise strongly in 2022, albeit from a low base, and with the reduced number of contractors in the market due to the Covid-19 crisis, tender prices are expected to rise by an annual 4.0% in 1st quarter 2023, outstripping input costs. Over the following year, demand continues to increase sharply, but input costs are tempered by improving exchange rates, with tender prices expected to rise by 4.3%. Over the final year of the forecast period, with increased new work output, tender prices are anticipated to rise by 4.2%, despite new work output in 2024 being 12% less than our January 2020 forecast. Upward pressure on site rates will also put upward pressure on tender prices during 2021 and 2022.
New tax legislation (IR35) which was due to come into force in April 2020, has been delayed until April 2021, and is designed to close a loophole and make the legislated level of tax payable on labour costs. This delay will allow for further representatives from the construction industry to be made. The increases will not appear in the General Building Cost Index, as labour rates are based on promulgated rates. However, the increases are expected to be reflected in tender prices, but the size of any increases are difficult to quantify. However, the Inland Revenue are predicting a windfall of £420m in tax and National Insurance contributions. It will depend on whether individuals effectively take a pay cut in their net income, or whether the additional burden is passed up the supply chain. BCIS has not currently made an adjustment to its forecasts for IR35 .
It has been assumed that there will not be a change in government over the forecast period.
It has been assumed that other member countries will not leave the Eurozone over the forecast period.
Table 8: BCIS forecast of tender prices
Period |
Forecast |
1Q2020 to 1Q2021 |
+2.4% |
1Q2021 to 1Q2022 |
+4.1% |
1Q2022 to 1Q2023 |
+4.0% |
1Q2023 to 1Q2024 |
+4.3% |
1Q2024 to 1Q2025 |
+4.2% |
Source: BCIS
1.1.4 Summary assumptions
1.1.4.1 Inflation
The rate of general inflation will be around 1.0% in 2020, 2.6% in 2021, 2.8% in 2022, 2.7% in 2023 and 2.7% in 2024. General inflation for the year is measured 4th quarter on 4th quarter of the previous year.
1.1.4.2 Demand
New work output will fall by 26% in 2020, then rise by 26% in 2021, 8% in 2022, 7% in 2023 and 8% in 2024.
1.1.4.3 Labour
Wage awards will be around 0% in 2020,4% in 2021, 4% in 2022 and 3% in 2023 and 2024.
1.1.4.4 Materials
The annual rate of change in materials prices will be around 5% over the first year of the forecast period, 4% over the following year, and then between 3% and 4% per annum over the final three years.
1.2 Upside scenario
1.2.1 Demand
The upside scenario is based on a slightly better outcome from the Covid-19 crisis in 2020. It is assumed that there will be a smoother withdrawal process from the EU than with the central forecast and that any trade agreements with the EU will be close to those prior to the EU Referendum. It is also assumed that any trade agreements with the rest of the world will boost the UK economy.
Table 9: BCIS new work output assumptions – upside scenario
Annual percentage change at constant prices
Period |
Forecast |
2020 |
-22.3% |
2021 |
+23.0% |
2022 |
+7.8% |
2023 |
+7.9% |
2024 |
+8.2% |
Source: BCIS
1.2.2 Building costs
Building costs are expected to grow at a similar rate over the forecast period compared with the central scenario, but with a slightly different profile. This results from greater access to European labour coming sooner, keeping wage agreements lower than the central forecast. Tariffs apply from January 2021 as per the central forecast, but in the upside scenario, agreement over new tariffs moves at a faster pace, leading to cheaper prices of imported materials over the second half of the forecast period. Higher demand puts upward pressure on materials prices as the forecast proceeds, tempered by improved sterling exchange rates and lower tariffs.
Table 10: Building costs – upside scenario
Period |
Forecast |
1Q2020 to 1Q2021 |
+2.5% |
1Q2021 to 1Q2022 |
+3.3% |
1Q2022 to 1Q2023 |
+3.7% |
1Q2023 to 1Q2024 |
+3.5% |
1Q2024 to 1Q2025 |
+3.2% |
Source: BCIS
1.2.3 Tender prices
Tender prices are expected to rise at the same rate as the central scenario over the first two years of the forecast, then rises a little faster than the central scenario over the remainder of the forecast period.
Table 11: Tender prices – upside scenario
Period |
Forecast |
1Q2020 to 1Q2021 |
+2.4% |
1Q2021 to 1Q2022 |
+4.1% |
1Q2022 to 1Q2023 |
+4.2% |
1Q2023 to 1Q2024 |
+4.6% |
1Q2024 to 1Q2025 |
+4.9% |
Source: BCIS
1.3 Downside scenario
This scenario assumes a longer l-shaped dip in new work output than in the central scenario, lasting an extra three months into January 2021. It is also assumed that there will be a 'no deal' at the end of the transition period in December 2020. It is assumed that following the transitional period, World Trade Organisation tariffs will apply to construction materials imported from EU and any subsequent trade agreements with the EU are a lot less favourable than before the EU Referendum.
This scenario assumes a double-dip recession in total new work output, with a deep recession in 2020, followed by a partial bounce back in 2021, but then falling again in 2022. Output then grows from a low base over the final three years of the forecast period. There is an assumption that the pipeline of infrastructure is cut back significantly from that in the central scenario, with the government needing to divert public sector funding towards paying off the huge debt resulting from the Covid-19 crisis. A greater move to working at home is assumed compared with the central forecast, affecting private commercial sector output.
The downside scenario does not include for a second wave of Covid-19.
Table 12: BCIS new work output assumptions – downside scenario
Annual percentage change at constant prices
Period |
Forecast |
2020 |
-30.7% |
2021 |
+14.5% |
2022 |
-6.2% |
2023 |
+6.6% |
2024 |
+8.5% |
Source: BCIS
1.3.1 Building costs
Following a 'no deal' in December 2020, cost increases rise faster than in the central scenario, resulting from restrictions on the movement of European labour putting upward pressure on costs due to the reduction in the available labour pool. This continues throughout the forecast period. After the 'no deal', it is assumed that sterling exchange rates fall towards parity, only improving towards the end of the forecast period. Tariffs on imported materials are applied from January 2021 and only start to be agreed at better rates from the last year of the forecast period. With output falling, there will be no upward pressure on costs from demand.
Table 13: Building costs – downside scenario
Period |
Forecast |
1Q2020 to 1Q2021 |
+2.5% |
1Q2021 to 1Q2022 |
+4.9% |
1Q2022 to 1Q2023 |
+4.1% |
1Q2023 to 1Q2024 |
+4.0% |
1Q2024 to 1Q2025 |
+4.1% |
Source: BCIS
1.3.2 Tender prices
Tender prices are forecast to start falling in 3rd quarter 2020, with a fall over the year to 1st quarter 2021 of 0.9%. Tender prices continue to fall through to 2nd quarter 2023, amounting to a total fall of 9%. This results in tender prices falling by 5.8% over the second year of the forecast period. With the recession easing and with strong growth in 2023, tender prices are expected to rise by an annual 0.6% in 1st quarter 2023. As output picks up in 2023 and 2024, albeit from a low base, tender prices are anticipated to rise by 3.8% and 4.9% respectively over the final two years of the forecast period.
Tender prices are also subject to strong upward cost pressures from 2021 and, from 1st quarter 2021, higher site rates, resulting from restrictions on labour movement from the EU.
The fall in tender prices is expected to be restricted somewhat, as although tender prices have risen by around 60% since the low point in the previous recession, tender prices are currently still only 32% above the pre-recession peak in 2007. In the period before the financial crisis of 2007, which led to the previous recession, tender prices had risen by some 140% over 23 years. Over the nine years preceding the previous recession, tender prices rose by over 70%.
Table 14: Tender prices – downside scenario
Period |
Forecast |
1Q2020 to 1Q2021 |
-0.9% |
1Q2021 to 1Q2022 |
-5.8% |
1Q2022 to 1Q2023 |
+0.6% |
1Q2023 to 1Q2024 |
+3.8% |
1Q2024 to 1Q2025 |
+4.9% |
Source: BCIS
1.4 Scenarios comparison
Below is a summary of the scenarios for comparison.
Table 15: Summary of scenarios
|
Percentage change |
||||
|
1Q2020 to 1Q2021 |
1Q2021 to 1Q2022 |
1Q2022 to 1Q2023 |
1Q2023 to 1Q2024 |
1Q2024 to 1Q2025 |
Central scenario |
|
|
|
|
|
TPI |
+2.4 |
+4.1 |
+4.0 |
+4.3 |
+4.2 |
GBCI |
+2.2 |
+4.1 |
+3.4 |
+3.3 |
+3.2 |
New work output * |
-26.3 (2020) |
+25.7 (2021) |
+7.6 (2022) |
+7.1 (2023) |
+8.4 (2024) |
Upside scenario |
|
|
|
|
|
TPI |
+2.4 |
+4.1 |
+4.2 |
+4.6 |
+4.9 |
GBCI |
+2.5 |
+3.3 |
+3.7 |
+3.5 |
+3.2 |
New work output * |
-22.3 (2020) |
+23.0 (2021) |
+7.8 (2022) |
+7.9 (2023) |
+8.2 (2024) |
Downside scenario |
|
|
|
|
|
TPI |
-0.9 |
-5.8 |
+0.6 |
+3.8 |
+4.9 |
GBCI |
+2.5 |
+4.9 |
+4.1 |
+4.0 |
+4.1 |
New work output * |
-30.7 (2020) |
+14.5 (2021) |
-6.2 (2022) |
+6.6 (2023) |
+8.5 (2024) |
* Constant prices 2016
Figure 7: New work output 2016 constant prices – alternative scenarios

Source: ONS, BCIS
Figure 8: BCIS General Building Cost Index – annual percentage change

Source: ONS, BCIS
Figure 9: BCIS All-in Tender Price Index – annual percentage change

Source: ONS, BCIS
Appendix A - Notes and definitions
The BCIS forecast is a national forecast. Regional differences in demand will have a consequential effect on tender prices in different parts of the country. The BCIS All-in Tender Price Index is constructed using projects based on traditional procurement routes.
Projects based on contractor-led procurement methods, such as design and build and partnering, are not included. However, the same general market conditions apply to all types of procurement routes but some will react more slowly to changes in demand.
Tender Price Indices
Generally, the tender price indices measure the trend of contractors' pricing levels in accepted tenders, i.e. cost to client, for schemes let on a lump sum basis.
Bills of quantities submitted to BCIS are repriced using a base schedule of rates, which is applied to a sample of bill items. The method aims to match a balance of trades, but M&E services and proprietary items are not usually matched. The 'base' tender figure is compared with the actual tender figure to produce a 'project index'. Standard adjustments are applied to the project index to remove some of the differences in index level expected for projects of different size, from different regions and using different procurement methods. These adjustments are reviewed from time to time. A large number of bills of quantities are indexed in this way and the resulting project index figures are averaged (using the geometric mean) to produce the published indices, which are therefore current weighted indices.
The BCIS Tender Price Indices are based on accepted tenders for new building work which have been priced in competition or by negotiation and let on single stage, traditional procurement, average value < £5m, (minimum £100,000, no maximum). The indexing process excludes M&E and other specialist trades, e.g. facades. BCIS has assumed this reflects market for single stage D&B and S&D.
To achieve stability in the indices, BCIS attempts to include 80 projects in each quarter; the more projects included, the more reliable the resultant index. The actual sample achieved is shown against each index figure to give some indication of the stability of the index. The variance of the project indices is such that when a sample of 80 schemes has been achieved, the 90% confidence interval is in the region of -2.7% to +2.8%.
All-in TPI: covers new building work in the UK and includes all sectors (public, private and housing). The index is based on a random sample of schemes selected from the BCIS membership.
From 4th quarter 2018, BCIS has introduced a new methodology for estimating the latest All-in Tender Price Index results. It is based on a panel (Delphi) survey approach. BCIS has recruited a panel of practising cost consultants from firms involved in multiple tenders in each quarter. The BCIS Panel Tender Price Index is intended to measure the trend of contractors' pricing levels in accepted tenders at commitment to construct, i.e. cost to client in the previous quarter (mid-quarter to mid-quarter).
A questionnaire asking for the individual panel members' experience in the last quarter is completed. The questionnaire also requests contextual details for the responses, i.e. location, size, procurement routes, building types. The results are analysed and reported to the panel for discussion. A consensus increase in the TPI is agreed following the discussion. The result is a percentage change in the quarter.
The index will be used to provide an estimate of the BCIS All-in Tender Price Index in the latest quarter. It will be combined with results from project indices until there are enough projects available to replace the estimate.
Modelled smoothing
From March 2020, to compensate for small sample sizes in individual quarters, a simple econometric model has been produced that relates quarterly change in the BCIS All-In TPI to key economic measures: the output from this model is used to incorporate project indices from other quarters into a quarterly index.
When there are less than 40 projects for the individual quarter, projects from the nearest nine quarters are added to the sample. These projects are adjusted to allow for cost changes in line with BCIS General Building Cost Index (Excluding Mechanical and Electrical) and for short term changes in economic conditions and the BCIS Panel Tender Price Index. The model used for estimating short term tender price movements uses fluctuations in UK unemployment and in Construction New Orders as reported by the Office of National Statistics.
Forecast: the forecast of the All-in Tender Price Index is based on the assumptions given in the briefing. BCIS examines a wide variety of economic indicators and ad hoc models based on their trends. BCIS also considers the results from an econometric model, which has been specifically tailored to include tender prices.
Input Cost Indices
Generally, the building cost indices measure changes in costs of labour, materials and plant, i.e. input cost to contractor. The indices are based on cost models of average buildings. The inputs to the indices are the Work Category Indices (Series 2) prepared by BCIS for use with the price adjustment formulae. Monthly indices are calculated and averaged to produce quarterly figures. The indices allow for changes in the costs of nationally agreed labour rates, materials prices and plant costs; they do not necessarily reflect changes in contractors' actual site costs. The models used are based on a sample of new-build schemes included in the BCIS All-in TPI between 1989 and 1993. The resultant series are therefore base weighted indices.
General Building Cost Index: includes all types of construction and all categories of work (i.e. including mechanical, electrical and lift installation work).
Forecast: the forecast of the General Building Cost Index and its constituent indices are based on the assumptions given in the Briefing. Forecasts of materials and various types of labour are applied to a cost model for an average building. Plant costs are assumed to move in line with materials costs. The forecast is calculated on a monthly basis and the quarterly figures are based on the mean of the monthly indices.
General Building Cost (Excl M&E) Index: includes all types of construction but excludes mechanical, electrical and lift installation work.
Basic Labour Cost Index: reflects the labour element of the model only and includes all categories of work.
Basic Materials Cost Index: reflects the materials element of the model only and includes all categories of work.
Market Conditions Index
The Market Conditions Index is based on the Tender Price Index deflated by the General Building Cost (Excl M&E) Index. The resultant index rises when tenders are increasing faster than costs and falls when costs rise faster than tenders. It is therefore an indication of the competitiveness of the tendering climate.
Forecast: the Market Conditions Index is forecast as part of the process of forecasting the Tender Price Index.
Standard error: a measure of the reliability of the sample mean as an estimate of the population mean, calculated by dividing an estimate of the standard deviation of the sample by the square root of the sample size. A small standard error indicates a more reliable sample mean.